")
")
MA, MV, and MT are three fundamental parameters used by LSFG-NAVI to classify the MBR (Mean Blur Rate: a relative index of blood flow velocity) within the optic nerve head (ONH) based on which region the MBR values are averaged over. Because they allow separate evaluation of blood flow in the overall, vascular, and tissue areas, they are extremely useful for assessing systemic circulation in healthy individuals and evaluating diseases such as diabetes and glaucoma. There are multiple methods for separating vascular and tissue blood flow depending on the purpose (e.g., Cross-sectional analysis, Histogram analysis, etc.).
LayerView Screen Appearance
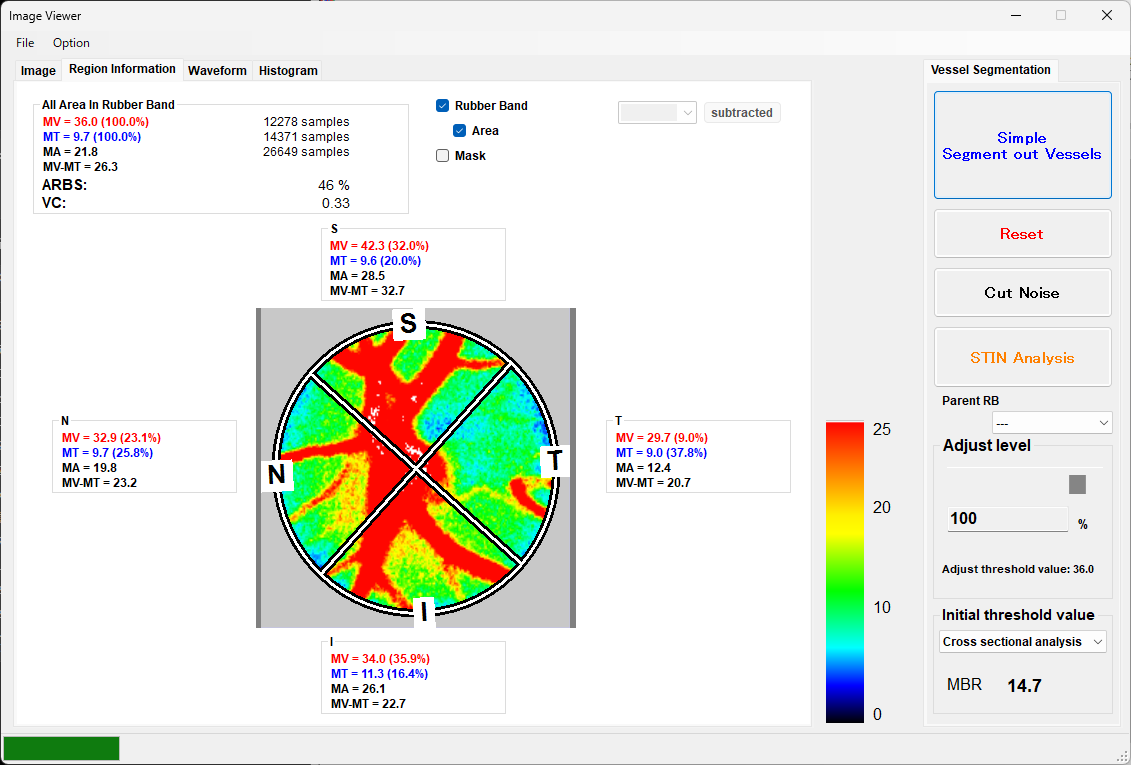
During STIN analysis, MV, MT, MA, and MV-MT are displayed for each of the superior/inferior/temporal/nasal sectors.
Meaning and Role of MA / MV / MT
In the ONH analysis of LSFG-NAVI, the area enclosed by the elliptical rubber band is automatically classified into vascular area and tissue area, and the MBR of each is averaged and quantified.
MA (Mean of All area)
-
The average MBR of the entire area within the rubber band (RB or ROI)
-
A comprehensive blood flow index combining vascular and tissue components
-
Used for an overall view of the blood flow status of the entire optic nerve head
-
Highly reproducible and one of the most commonly used indices in clinical research
In clinical use, the examiner can easily identify regions, and stable numerical values are obtained. In healthy individuals, the vascular area occupies approximately 40% of the entire optic disc. Since the vascular area has a higher MBR than the tissue area, it contributes significantly to MA. When the vascular area contracts, the proportion of the vascular area (referred to as ARBS) decreases, causing MA to decrease more than the actual change in blood flow. When blood flow through the large vessels decreases, MA responds more sensitively. For example, in cases where retinal large vessel blood flow is reduced due to arrhythmia, heart failure, etc., changes in MA become apparent.
MV (Mean of Vascular area)
-
The average MBR of the vascular area (retinal vessels)
-
Reflects blood flow in the vascular component within the optic nerve head
This includes the central retinal artery/vein and background tissue blood flow. Since the blood flow in the central retinal artery and vein is much greater than that in the tissue, the central retinal artery and vein blood flow is dominant.
-
Susceptible to the influence of vessel diameter and vascular density
-
Important for evaluating circulatory disorders
Since blood pumped from the heart flows directly through the ophthalmic artery and into the central artery, MV is considered to reflect blood flow dynamics on the central (proximal) side. The rubber band placed around the optic nerve head includes the central retinal artery and vein. The central retinal artery and vein are large vessels and have a large flow velocity distribution in the direction of the vessel diameter (cross-sectional and depth direction), so the MBR of the vascular area captured by the rubber band represents this varying velocity distribution. Originally, blood flow through a large vessel is expressed as cross-sectional area × average flow velocity, but since MV divides by the cross-sectional distance while maintaining depth information, MV is considered to be a value closer to average flow velocity rather than blood flow volume. In fact, there is a report1 showing a good correlation between MV and TRFI/W (TRFI, which is relative blood flow volume, divided by vessel width) (R2=0.615, p<0.0001). A high MV does not necessarily mean high blood flow volume in the retinal large vessels; a high MV may also indicate a narrow vessel diameter with high blood flow velocity. Since the central artery and vein are intermediate pathways for peripheral circulation, it may be better to focus on TRFI (the sum of RFV across retinal vessels extending beyond the disc) or changes in peripheral blood flow to capture actual blood flow volume.
MT (Mean of Tissue area)
-
The average MBR of the tissue area (optic disc tissue)
-
Reflects blood flow in the parenchyma of the optic nerve head (nerve fiber layer, glial tissue, etc.)
-
Allows evaluation of the circulatory status of tissue excluding vessels as blood flow volume (note: differences in pigmentation should be considered when comparing between individuals)
-
The relationship between glaucoma progression and structural changes in the ONH has been studied
MT represents blood flow supplied to the optic nerve head tissue area via the short posterior ciliary arteries branching from the ophthalmic artery. In contrast to MV, which represents blood flow on the central (proximal) side, MT represents blood flow on the peripheral (choroidal) side, enabling observation of the nutritional status provided by peripheral blood flow. Multiple reports2,3 show that MT correlates with absolute blood flow volume. The question of why MT correlates with blood flow volume arises from the difference between whether the detected pixels include the entire vascular structure or only a part of it. In the case of MT, each pixel contains multiple capillaries, meaning it observes multiple capillaries simultaneously. On the other hand, each pixel constituting MV represents only a part of the vascular structure, and each pixel constituting MV does not represent the blood flow of the target vessel as a whole. Since each pixel constituting MT already represents an average value that includes the capillary structure, the parameter MT, which averages these values, consequently correlates with the absolute blood flow volume of the target area.
What is MV-MT?
MV-MT is the value obtained by subtracting MT (tissue area blood flow) from MV (vascular area blood flow), and is a derived parameter for emphasizing the "vascular component dominance" within the optic nerve head.
Since the background tissue blood flow is subtracted, MV-MT is a parameter that captures changes in the central retinal artery and vein more sensitively than MV alone. As mentioned above, a high MV does not necessarily mean that MT also increases. Even when the effective blood flow volume is low (i.e., the blood flow volume reaching the peripheral side is low), there is a possibility that the artery contracts, increasing blood flow velocity and raising MV. In fact, while the pathways for MT and MV differ—the short posterior ciliary artery pathway and the central retinal artery pathway, respectively—comparing them in terms of peripheral versus central blood flow contrast should be meaningful.
In this context, MV-MT, which subtracts the tissue blood flow component MT, is considered a value that more closely reflects blood flow on the central (proximal) side.
Reasons for Using MV-MT
- To examine the balance between vascular and tissue components
The optic nerve head contains a mixture of vessels and tissue, and it is important to know how much blood flow each component accounts for. MV-MT shows this balance at a glance.
Potentially Useful for Disease Evaluation
Research has reported tendencies for MT to decrease in conditions such as:
-
Glaucoma
-
Optic neuropathy
-
Circulatory disorders
On the other hand, a study7 analyzing the factors contributing to individual differences in MV and MT in normal eyes has shown that MT and MV are independent circulatory indices. The fact that MT and MV are independent means that MV-MT can be used as an index for relatively capturing the decline in tissue blood flow.
■ Definition
In other words:
-
How much higher the vascular blood flow is compared to the tissue
-
An index that quantifies the dominance of vascular blood flow (the "distribution dominance" of large vessels and the "anatomical dominance/nutrient vessels")
Comparison of the Four Parameters
| Parameter | Target Area | Meaning | Primary Use |
|---|---|---|---|
| MA | All areas | Blood flow of the entire optic nerve head | Overall evaluation, high reproducibility |
| MV | Vascular area | Retinal vessel blood flow (central/proximal side, reflecting central retinal artery and vein) | Evaluation of vascular component circulation |
| MT | Tissue area | Optic disc tissue blood flow (peripheral side, supplied from the short posterior ciliary arteries on the choroidal side, reflecting tissue blood flow) | Tissue circulation, glaucoma evaluation |
| MV-MT | Vascular area |
Retinal vessel blood flow (excluding background tissue blood flow) |
CRVO4,5, BRVO, optic neuropathy, systemic circulation central-side evaluation, circulatory disorders |
Clinical Points
● High Reproducibility
MA, MV, and MT have all been reported6 to have high intra-examiner and inter-examiner reproducibility. (e.g., in the glaucoma group: MA CV=5.3%, MV CV=4.2%, MT CV=2.5%)
-
In glaucoma, the decrease in MT (tissue blood flow) is particularly notable
-
There are also reports suggesting that changes in the tissue area (MT) may correlate with structural changes more than the vascular area (MV)
● Combined Use with Pulse Waveform Analysis
MT and MV are also used in pulse waveform analysis (such as Blowout Score), enabling more detailed evaluation of the circulatory dynamics of the optic nerve head7
Methods for Separating Vascular and Tissue Blood Flow
- Cross-sectional analysis
- A method that preferentially extracts tissue blood flow (MT): Used when stable extraction of peripheral tissue blood flow is desired. Suitable for diseases such as glaucoma and for observing peripheral blood flow dynamics in healthy individuals.
- Histogram analysis
- A method that preferentially extracts the vascular area (MV): Used when stable extraction of large vessels with minimal tissue blood flow interference is desired. Histogram analysis is used when calculating TCR, which measures peripheral vascular resistance from large vessels. Suitable for diseases where TCR is utilized, such as CRVO, BRVO, age-related arteriosclerosis, and for observing blood flow dynamics of the larger vessels in healthy individuals.
- Manual
- Used when manually delineating vascular and tissue areas. This method divides the MBR within the rubber band placed on the optic nerve head using a single threshold value. Pixels with MBR above the threshold are classified as vascular, and those below as tissue blood flow for calculation.
References
- Michelle R. Tamplin, Kimberly A. Broadhurst, Anthony H. Vitale, Ryuya Hashimoto, Randy H. Kardon and Isabella M. Grumbach
Longitudinal Testing of Retinal Blood Flow in a Mouse Model of Hypertension by Laser Speckle Flowgraphy
Translational vision science & technology, 10(2), 16-16, doi:10.1167/tvst.10.2.16, 2021. [Link] - Hiroaki Takahashi, Tetsuya Sugiyama, Hideki Tokushige, Takatoshi Maeno, Toru Nakazawa, Tsunehiko Ikeda, Makoto Araie
Comparison of CCD-equipped laser speckle flowgraphy with hydrogen gas clearance method in the measurement of optic nerve head microcirculation in rabbits
Experimental Eye Research(2012), http://dx.doi.org/10.1016/j.exer.2012.12.003 doi:10.1016/j.exer.2012.12.003 [Link] - Naoko Aizawa, Fumihiko Nitta, Hiroshi Kunikata, Tetsuya Sugiyama, Tsunehiko Ikeda, Makoto Araie and Toru Nakazawa
Laser speckle and hydrogen gas clearance measurements of optic nerve circulation in albino and pigmented rabbits with or without optic disc atrophy.
Investigative Ophthalmology & Visual Science, IOVS-14, 2014. doi: 10.1167/iovs.14-15373 [Link] - Matsumoto Makiko, Suzuma Kiyoshi, Fukazawa Yoshiko, Yamada Yoshihisa, Tsuiki Eiko, Fujikawa Azusa and Kitaoka Takashi
Retinal blood flow levels measured by Laser Speckle Flowgraphy in patients who received intravitreal bevacizumab injection for macular edema secondary to central retinal vein occlusion.
Retinal Cases and Brief Reports, 8(1), 60-66, 2014. doi:10.1097/icb.0000000000000005 [Link] - Makiko Matsumoto, Kiyoshi Suzuma, Fumito Akiyama, Kanako Yamada, Shiori Harada, Eiko Tsuiki and Takashi Kitaoka
Retinal Microvascular Resistance Estimated from Waveform Analysis Is Significantly Higher With a Threshold Value in Central Retinal Vein Occlusion
Translational Vision Science and Technology, 9(11), 4, doi:10.1167/tvst.9.11.4, 2020. [Link] - 小川 莉奈、斎藤 彩、江黒 友春、永野 幸一、山口 純、庄司 信行
レーザースペックルフローグラフィーにおける視神経乳頭血流の再現性および一致性
日本視能訓練士協会誌, 50, 129-134, doi:10.4263/jorthoptic.50F115, 2022. - Ayako Anraku, Nobuko Enomoto, Goji Tomita, Aiko Iwase, Takashi Sato, Nobuyuki Shoji, Tomoaki Shiba, Toru Nakazawa, Kazuhisa Sugiyama, Koji Nitta and Makoto Araie
Ocular and Systemic Factors Affecting Laser Speckle Flowgraphy Measurements in the Optic Nerve Head
Translational Vision Science & Technology, 10(1), 13, doi:10.1167/tvst.10.1.13, 2021. [Link]
Revision:20260211