")
")
In a word, please consider it as mean resistance. Blood vessels undergo contraction and dilation with each heartbeat to deliver blood flow to the periphery, and resistance changes from the systolic to the diastolic phase. The effective blood flow that carries nutrients increases or decreases depending on the mean resistance, so it is suitable for observing permanent resistance values.
A higher value indicates higher resistivity, and a lower value indicates lower resistivity.
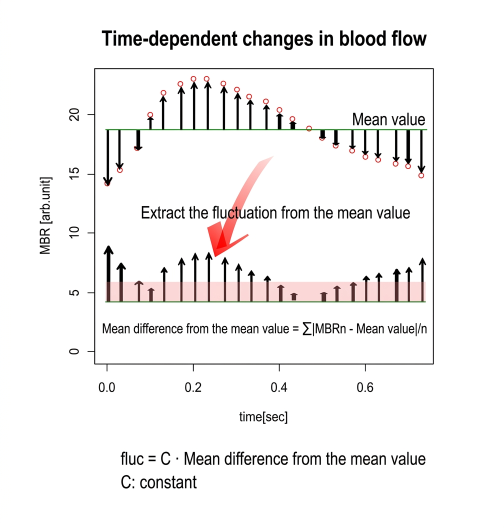
Please refer to the diagram on the right for an explanation of fluctuation.
It is a metric that displays high values for items with large fluctuations and low values for items with small fluctuations, representing a fluctuation rate similar to AC/DC.
The formula involves accumulating the differences between each sample value and the mean, taking the average, multiplying by a coefficient for readability, and dividing by the mean.
The difference from resistivity values of BOS and BOM is that fluctuation is calculated for each point of the temporal change in blood flow within one heartbeat, so it reflects not only the resistance during the systolic phase but also the resistance through the diastolic phase. For this reason, we consider it as mean resistance.
Since the amount of variation from the mean is accumulated and divided by the mean, you may understand it as something close to variance in statistical terms.
When considering the fluctuation rate map for fundus blood vessels, arteries tend to show higher fluctuation rate values compared to veins because their fluctuation is greater. However, it does not seem to separate arteries and veins as clearly as Skew.