")
")
MBR stands for Mean Blur Rate, representing the average blur rate. Just as a fast-moving object appears blurred when photographed, MBR quantifies this blur rate and is proportional to the migration speed of blood cells.
To help you conceptually understand that MBR shows a proportional relationship with the speed of the measured object, here is an explanation using a simple model.
The horizontal axis represents the exposure time of an image sensor such as a CCD, and the vertical axis represents the fluctuation of speckle light intensity reflecting the movement of the measured object. The green area in the figure is the actual output from the image sensor.
When scattering particles (blood cells, etc.) move slowly
The image captured by the CCD shows little blur because the subject being captured (speckle patterns reflecting the movement of scattering particles) moves slowly, resulting in a low MBR value.
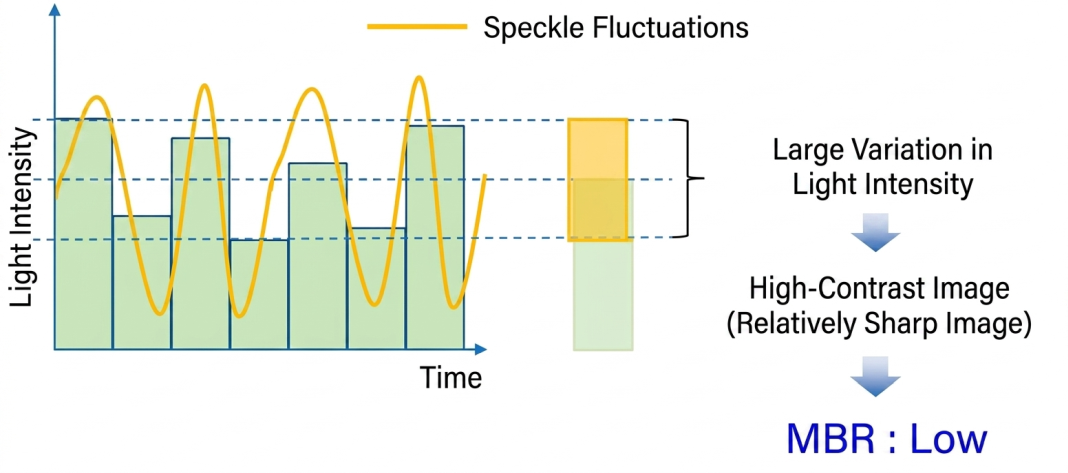
When scattering particles (blood cells, etc.) move quickly
The image captured by the CCD shows more blur because the subject being captured (speckle patterns reflecting the movement of scattering particles) moves quickly, resulting in a high MBR value.

This can be translated into the relationship between the mean (sample mean) and deviation (sample deviation) of samples randomly extracted from a large population in stochastic processes.
When the number of samples N is increased, the sample mean gradually approaches the population mean. The deviation takes large values when N is small, but takes smaller values as N increases.
In MBR, which is the reciprocal of the variation from the sample mean (≈ sample deviation), the value becomes proportional to the speed of the measured object.
LSFG is not yet able to display absolute flow velocity, such as "this vessel has a flow rate of X millimeters per second."
It is known that the indicated values change depending on several factors including vessel diameter and vessel wall thickness, and this remains an ongoing research topic.
If absolute flow velocity can be determined, retinal vascular blood flow volume can be calculated by measuring vessel diameter.
However, for tissue blood flow, this would still be quite difficult.
Nevertheless, two-dimensional blood flow maps contain a great deal of information, and comparisons between different sites as well as tracking of temporal changes can be easily performed.
Even without knowing absolute velocity, it appears to be sufficiently useful for diagnosis, such as confirming improvement in blood flow before and after treatment.
Compared to other methods, it is far more user-friendly, and its reproducibility and reliability are more than adequate.
Leakage is caused by neovascularization, and since peripheral blood flow is low in such areas, LSFG shows low values.
On the other hand, when leakage is detected by FA (fluorescein angiography) or similar methods, it appears as fluorescent spots; however, since blood flow is low in those areas, LSFG depicts them as low values.
If the area surrounding the leakage site also has low blood flow, the leakage site will only show a distribution of low values on LSFG, making it impossible to confirm the presence of leakage.
Dr. Watanabe of Gunma University has published well-organized papers on this topic, which we introduce as references for your review.
Watanabe G, Fujii H, Kishi S: Imaging of Choroidal Hemodynamics in Eyes with Polypoidal Choroidal Vasculopathy Using Laser Speckle Phenomenon Jpn J Ophthalmol 52: 204-210, 2008
It is not possible to compare multiple files within a single analysis software instance, but it is possible to launch multiple instances of the analysis software.
Depending on the performance of the computer, three or four instances can be launched without any issues on the computers we have installed.
If multiple analysis software instances are running, the measurement software may not be able to start, so please do not launch multiple analysis software instances during measurement.
When LD output is increased, the values tend to become slightly higher, particularly in vessel areas.
In tissue blood flow areas, the light is sufficiently scattered, so the values do not change much unless the LD output is extremely reduced.
This is thought to be due to the following reasons.
- "Increased light scattering events due to increased light intensity"
When LD output is increased, light penetrates deeper into the measurement site.
If the tissue reached scatters light well, multiple scattering occurs repeatedly, reducing coherence and consequently lowering the speckle contrast.
Since MBR values are the reciprocal of contrast, when contrast decreases, the values increase, resulting in slightly higher values than the actual blood flow velocity as described above.
The issue is that the degree of this increase depends on the scattering characteristics of the tissue.
Therefore, during measurement, please ensure the laser level is approximately the same as when the previous measurement was taken.
Tip: By double-clicking the measurement data from the previous session in the clipboard, you can open the measurement screen with the same laser level as the previous measurement.
- "Detection limits exist when digitizing image signals"
This is a problem that occurs when LD intensity is set extremely high or low. The speckle signal received by the CCD camera is converted into integers from 0 to 255 and stored in memory.
At this point, even if light brighter than 255 enters, the value is stored as 255.
This state is commonly called signal clipping (or saturation), and when displayed as a grayscale image, it appears as an entirely white image.
When each pixel becomes mostly 255, the contrast decreases (and the reciprocal blood flow value is displayed higher).
When strong specular reflection is accidentally captured, such as from a contact lens, a bright red sun-like artifact appears in the blood flow map.
Conversely, if the light intensity is too low, 4.1 is stored as 4, and 4.9 is also stored as 4. Since the decimal information is lost, the statistical error increases, value variation increases, and the image becomes grainy.
To avoid these issues, please adjust the LD level so that the area you want to measure appears approximately green (around a value of 100) in the LD intensity map.

LD intensity map adjustment example
When you want to observe optic disc and choroidal blood flow simultaneously, the light intensity levels differ significantly, so it can be difficult to decide which one to match.
For reference, if you take one shot at each different level, you will not later regret that the laser level for the retina outside the optic disc was too dark.