")
")
In a word, it represents the ease of blood flow blow-through within one heartbeat. A higher value indicates easier blow-through and lower resistance, while a lower value indicates weaker blow-through and higher resistance.
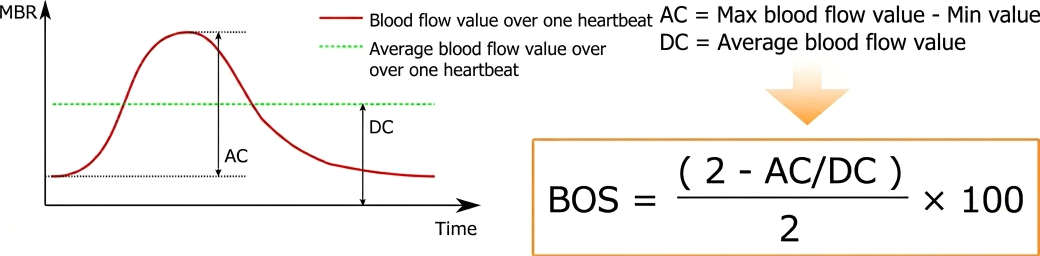
Blood flow fluctuation (= blood flow amplitude) is considered proportional to the power of blood flow caused by the heartbeat, and this power causes maximum dilation of the vessel during systole. This blood flow fluctuation is the difference between the blood flow at maximum expansion (MAX) and the steady-state flow during diastole (MIN). Since this difference is caused by the pressure difference of the heartbeat, the parameter obtained by dividing this heartbeat-induced blood flow fluctuation by the mean blood flow value is considered to represent blood flow resistance (maximum resistance).
Based on this concept, BOS (Blowout Score) was developed as a resistance parameter to evaluate the amount of blood flow that blows through the vessel during one heartbeat*1. If the maximum score of a test is 100 points, BOS is a scale-converted value where approximately 80, which is considered an optimal level, is set as the optimum value.
BOS is considered an index related to vascular resistance, and it is thought to evaluate how well blood flow is maintained during one heartbeat.
The difference from Fluctuation, which also indicates resistance, is that BOS more strongly reflects systolic resistance, whereas Fluctuation represents resistance dominated by the diastolic phase. BOS and similar parameters may be more suitable for discussing the resistance of the heart's pumping mechanism and simple large vessel resistance, while Fluctuation may be more suitable for discussing the resistance of the peripheral vascular bed.
The name BOS was proposed by Toho University Medical Center Sakura Hospital, which has been actively exploring applications in internal medicine and cardiology, to make it clinically intuitive and easy to understand.
The components used to derive BOS are the steady-state component of blood flow (DC: mean blood flow) and the fluctuation component (AC: range of blood flow variation).
When the steady-state component (DC) is high, blood flow is evaluated as being stably maintained, and BOS shows a high value.
When the steady-state component (DC) is low and the fluctuation component (AC) is high, blood flow is evaluated as not being stably maintained, and BOS shows a low value.
Below are choroidal blood flow waveforms from age-grouped samples.
A correlation between BOS and age has been reported*1, and as a trend, BOS decreases with aging.
| 20s | 30s | 60s |
 |
 |
 |
| BOS=86 (AC=4 / DC=15) | BOS=83 (AC=3 / DC=9) | BOS=66 (AC=6 / DC=9) |
| The steady-state component (DC) is high, and BOS shows a high value. | Compared to the 20s, the steady-state component (DC) has decreased, and BOS has declined. | Compared to the 30s, the fluctuation component (AC) has increased, and BOS has declined. |
Additionally, there are reports*1 that BOS reflects arteriosclerosis and large vessel stiffness.
BOS is associated with aging, arteriosclerosis, and large vessel stiffness, and as aging and stiffness progress, BOS decreases.
In other words, it has been reported that blood flow is not maintained in a steady state and fluctuations become larger.
The normal range of BOS is considered to be in the vicinity of 75, but further investigation and verification of the normal range by comparing with healthy subject data is needed.
BOS is positioned as a core pulse‑waveform parameter reflecting blood‑flow stability.
BOS is a primary outcome strongly and independently associated with HbA1c*2.
Key findings:
-
ONH‑BOS: independently associated with age, gender, pulse pressure, heart rate, spherical refraction, and HbA1c.
-
Choroid‑BOS: independently associated with age, height, pulse pressure, heart rate, and HbA1c.
Recent Reports
- Tomoaki Shiba, Mao Takahashi, Tadashi Matsumoto and Yuichi Hori
Pulse Waveform Analysis in Ocular Microcirculation by Laser Speckle Flowgraphy in Patients with Left Ventricular Systolic and Diastolic Dysfunction
Journal of vascular research, 55(6), 329-337, doi:10.1159/000494066, 2018. [Link] - Chieko Shiba, Tomoaki Shiba, Mao Takahashi, Tadashi Matsumoto and Yuichi Hori
Relationship between glycosylated hemoglobin A1c and ocular circulation by laser speckle flowgraphy in patients with/without diabetes mellitus
Graefe's Archive for Clinical and Experimental Ophthalmology, doi: 10.1007/s00417-016-3437-4, 2016. [Link]
[Waveform Patterns and BOS]
When the mean blood flow (DC) within one heartbeat is low, BOS shows a low value.
 |
 |
 |
When the mean blood flow decreases, BOS also decreases. |
| BOS: Hi | BOS: Low |
When the mean blood flow (DC) within one heartbeat is low and the amplitude (AC) is large, BOS shows a low value.
 |
|
 |
When the fluctuation component is large, BOS decreases. |
| BOS: Hi | BOS: Low |
[Supplementary Note]
Before BOS was formulated with its current equation, it was displayed as "AC/DC" in the analysis software. Considering clinical ease of understanding, the name was changed to BOS and the formula was revised to the current one.
[Notes Regarding BOS]
In areas where an opaque, thick membrane (such as the stratum corneum or retinal pigment epithelium) that appears to have low blood flow velocity covers the upper layer, it obscures underlying areas with abundant blood flow. As a result, the response is lower than the actual blood flow fluctuation, and BOS may show a higher value than expected.