")
")
MBR stands for Mean Blur Rate, representing the average blur rate. Just as a fast-moving object appears blurred when photographed, MBR quantifies this blur rate and is proportional to the migration speed of blood cells.
To help you conceptually understand that MBR shows a proportional relationship with the speed of the measured object, here is an explanation using a simple model.
The horizontal axis represents the exposure time of an image sensor such as a CCD, and the vertical axis represents the fluctuation of speckle light intensity reflecting the movement of the measured object. The green area in the figure is the actual output from the image sensor.
When scattering particles (blood cells, etc.) move slowly
The image captured by the CCD shows little blur because the subject being captured (speckle patterns reflecting the movement of scattering particles) moves slowly, resulting in a low MBR value.
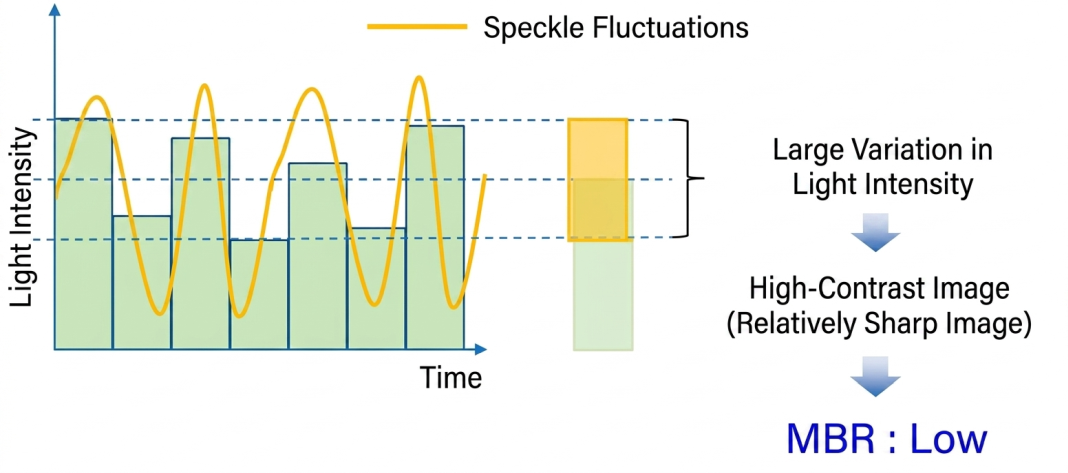
When scattering particles (blood cells, etc.) move quickly
The image captured by the CCD shows more blur because the subject being captured (speckle patterns reflecting the movement of scattering particles) moves quickly, resulting in a high MBR value.

This can be translated into the relationship between the mean (sample mean) and deviation (sample deviation) of samples randomly extracted from a large population in stochastic processes.
When the number of samples N is increased, the sample mean gradually approaches the population mean. The deviation takes large values when N is small, but takes smaller values as N increases.
In MBR, which is the reciprocal of the variation from the sample mean (≈ sample deviation), the value becomes proportional to the speed of the measured object.
LSFG is not yet able to display absolute flow velocity, such as "this vessel has a flow rate of X millimeters per second."
It is known that the indicated values change depending on several factors including vessel diameter and vessel wall thickness, and this remains an ongoing research topic.
If absolute flow velocity can be determined, retinal vascular blood flow volume can be calculated by measuring vessel diameter.
However, for tissue blood flow, this would still be quite difficult.
Nevertheless, two-dimensional blood flow maps contain a great deal of information, and comparisons between different sites as well as tracking of temporal changes can be easily performed.
Even without knowing absolute velocity, it appears to be sufficiently useful for diagnosis, such as confirming improvement in blood flow before and after treatment.
Compared to other methods, it is far more user-friendly, and its reproducibility and reliability are more than adequate.