")
")
After the automatic setting, you can manually reset the minimum frames using the graph.
If the automatic heartbeat detection incorrectly identifies one heartbeat as two, it is a false detection, so by removing this frame from the minimum frame setting, you can obtain a clean heartbeat map.
As for the method, we actually decided not to include it in the user manual, thinking that busy ophthalmologists would find it difficult to perform such manual settings, and instead provide instructions here when inquired. That said, the method is not particularly difficult.
1. Open the lsf file, and set a rubber band on the blood flow map in an area where pulsation is easily visible, such as over a blood vessel or broadly over the choroid.
# If a rubber band is already set, this step is not necessary.
2. Press the "Blood Flow" button.
Tracking and heartbeat analysis will be performed, and a Composite or HeartBeat blood flow map will be displayed.
3. Press the "Blood Flow" button once more.
4. Press the "Graph" button.
5. The graph window will open. Click "Option" - "Set Beat Timing Manually" from the graph window menu.

5. The blood flow values of the rubber band will then be displayed as a bar graph in time series, and the minimum frames should be shown in green.

Gray frames are those set as error frames due to tracking errors, etc.
Double-click on a frame that you think is a minimum frame to turn it green.
To deselect a minimum frame, double-click it again to remove the setting.
If the bar graph is too fine to set easily, you can freely zoom in on the graph.
Drag the mouse from the upper left to the lower right over the area you want to enlarge.
To move the graph, right-drag.
To return to the original graph size, drag from the lower right to the upper left anywhere on the graph.
6. When the setting is complete, press the "Setup" button at the lower right of the graph window.
This will recreate the composite map based on the manually set frames.
■ Full Question
During examination, when a round halation resembling corneal reflection appears in the iris viewer, the actual blood flow map image also shows a round shadow—sometimes in black, and sometimes in red or yellow as if blood flow were present—overlapping the optic nerve and interfering with measurement. What is the cause?
■ Answer
This is likely not caused by a scratch or defect inside the eyeball, but rather by the speckle-side laser light reflecting off the corneal surface and being captured by the speckle camera. When this round halation is observed, isn't there also a reflection pattern in yellow, red, or similar colors indicating strong reflected light within the light intensity map displayed at the lower left of the measurement screen during blood flow measurement? In such cases, the speckle instrument is not capturing signals from the actual fundus light, resulting in patterns that differ from the actual fundus blood flow pattern, and the expected optic nerve head blood flow map cannot be obtained.
As a solution, this halation must be avoided.
Since the laser light is returning as direct reflection from the corneal surface, try moving the fundus camera slightly to the left or right, or up or down, so that the direct reflected light does not enter the speckle camera, and try deflecting the corneal reflected light causing the halation upward.
Alternatively, applying eye drops to slightly change the condition of the cornea may also help.
However, in this case, to ensure stable measurement, the timing of the eye drop application and the measurement must be coordinated.
■ Full Question
We perform all cases with mydriasis, but even with mydriasis, there are occasions when the upper and lower laser beams cannot fit within the pupil diameter. It feels difficult at moderate mydriasis. Even when irradiating from the very edge of the pupil margin, there were several patients where either the upper or lower beam could not fully enter.
What pupil diameter (in mm) is needed to ensure reliable imaging?
■ Answer
The NAVI (dual-beam type) is designed so that the laser passes through the inside of a circle with a diameter of just under 5 mm.
Measurement is possible if the pupil is dilated wider than the circle drawn on the iris viewer screen at the lower right of the display.
However, this instrument is very sensitive to the anteroposterior alignment. Misalignment of the anteroposterior position between the eyeball and the camera can make it difficult for the laser to enter.
Please note that if the subject moves after the initial focus adjustment in the iris viewer, it becomes difficult for the laser to enter.

Iris Viewer
LSFG cannot measure absolute flow velocity such as an average speed of a certain number of millimeters per second.
With LSFG, it is possible to compare temporal changes in blood flow values at the same site.
For example, by measuring and comparing blood flow values before and after surgery, it is possible to confirm the effectiveness of the procedure.
In LSFG, veins—which have slower flow through larger-diameter vessels—show higher blood flow values than arteries, which have faster flow through narrower vessels.
In arteries with thick vessel walls, the laser does not penetrate to the vessel interior, so stationary scattering particles (vessel tissue) are reflected, resulting in lower blood flow values.
Conversely, in veins with thin vessel walls, the laser penetrates to the vessel interior, so moving scattering particles (blood cells) are reflected, resulting in higher blood flow values.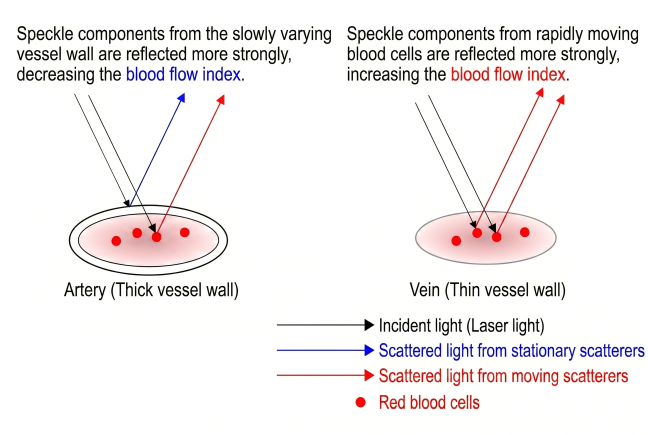
Due to these circumstances,
arguments such as "LSFG cannot numerically compare arterial and venous blood flow," or
"The retinal blood vessel blood flow is 40, and the choroidal blood vessel value is 10, so the choroidal flow speed is 1/4 of the retinal vessel speed"
cannot be made. Please note that "what can be done is to compare changes in blood flow at the same site."
LSFG quantifies speckle blur as the blur rate and uses it as the blood flow evaluation quantity.
The blood flow evaluation quantity has evolved as shown in the table below throughout the history of LSFG development.
The key point is the image sensor used to observe the speckles.
Previously, a custom-made area sensor with high temporal resolution was used, but it became difficult to obtain, and currently a general-purpose CCD camera is used.
| Blood Flow Evaluation Quantity |
Image Sensor | Overview |
| BR value (Blur Rate value) = NB value (Normalized Blur) |
Custom-made Pixels: 100×100 Scan cycle: 1/500 [sec] |
The reciprocal of the standard deviation of light intensity detected by the image sensor was used as the blood flow evaluation quantity. The BR value has a physical meaning as the S/N ratio (Signal to Noise ratio), which is the reciprocal of the speckle intensity contrast. |
| SBR value (Square Blur Rate value) |
Custom-made Pixels: 100×100 Scan cycle: 1/500 [sec] |
While the BR value had been used as the blood flow evaluation quantity, it was found that the linearity of the BR value deteriorated as blood cell movement velocity increased. Subsequent research revealed that the square of the BR value is proportional to blood cell movement velocity, so the SBR value, which is the square of the BR value, was adopted as the blood flow evaluation quantity. |
| MBR value (Mean Blur Rate value) |
General-purpose CCD Pixels: 750×360 Scan cycle: 1/30 [sec] |
Since the custom-made area sensor became difficult to obtain, research was conducted to derive the blood flow evaluation quantity using a general-purpose CCD camera, resulting in the creation of the MBR value. Because sufficient temporal resolution could not be obtained with a general-purpose CCD camera, a method was devised to compensate for the insufficient temporal resolution with broader spatial resolution. The MBR value is a blood flow evaluation quantity calculated from values obtained from both temporal and spatial variations. |
References
- Naoki Konishi, Yoshinori Tokimoto, Kazuhiro Kohra and Hitoshi Fujii
New Laser Speckle Flowgraphy System Using CCD Camera
Optical Review, 9, No.4, 163-169, 2002 doi:10.1007/s10043-002-0163-4 [Link] - Tetsuya Sugiyama
Basic Technology and Clinical Applications of the Updated Model of Laser Speckle Flowgraphy to Ocular Diseases
Photonics, 1, no.3, 220-234, 2014. doi:10.3390/photonics1030220 [Link]
Relationship Among the Blood Flow Evaluation Quantities
The relationships among the blood flow evaluation quantities are summarized as follows:
SBR = BR2
MBR = 2 × SBR = 2 × BR2
The BR value and SBR value differ in their linearity with respect to velocity. In high-velocity regions such as vessels, both the displayed values and their rates of change differ.
The SBR value and MBR value have a simple relationship of MBR = 2 × SBR.