")
")
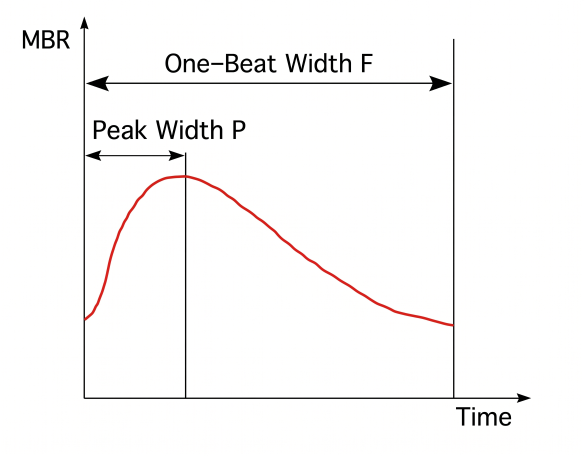
ATI indicates where within one heartbeat the blood flow peak occurs at the observation point, and typically shows a value of approximately 25–30%.
In peripheral regions where the pathway is longer and it takes more time for the blood flow peak to arrive, ATI becomes higher. Therefore, ATI becomes higher in cases such as venous regions where the waveform peak position is delayed compared to arteries.
Additionally, when the heart rate is high and the period of one heartbeat is short, ATI also becomes higher.

When expressed as a percentage, the value ranges from 0 to 100, but in some cases (such as Cobitos), it may be expressed as a decimal from 0 to 1.0, such as 0.3.
ATI stands for "Acceleration Time Index."
ATI was originally called "Peak," but the name was changed to "ATI" to make it easier to use in English-language publications.
In a word, it is a value that represents the resistivity of blood flow. The higher the BOM, the higher the resistivity.
BOM (BS Over MBR) does not require an average waveform of one heartbeat like BOS and other parameters, so it can measure resistivity even in blood flow waveforms with arrhythmia. In this regard, compared to other waveform parameters, values are easier to obtain, making it a clinically suitable resistivity parameter.
Clinical applications include observation of BRVO1 and age-related hemodynamic changes2.
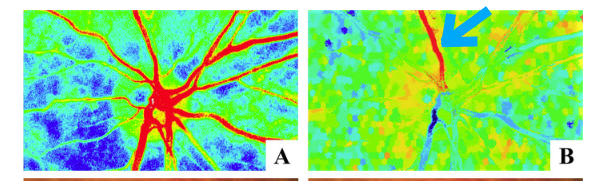
- Application in BRVO
The maps below are excerpts from a paper1 reporting a BRVO case. The left side shows the blood flow map and the right side shows the resistivity (BOM) map.
The red areas in the BOM map on the right side are regions with high resistivity, and it can be confirmed that resistivity is elevated (blue arrow) due to vascular stenosis.
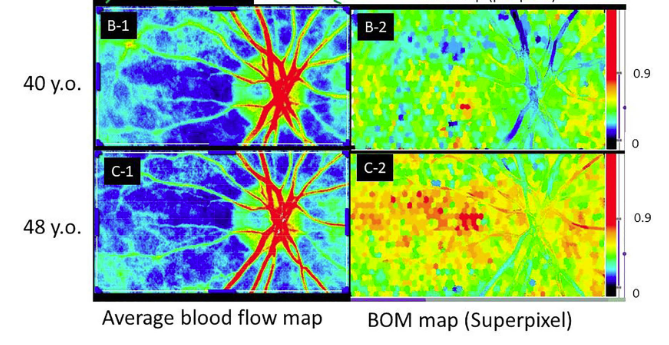
- Age-related hemodynamic changes
The maps below are also excerpts from a paper2. They show the blood flow maps (left side) of the same subject and their corresponding resistivity (BOM) maps (right side).
There is an 8-year difference between the upper and lower rows. While the blood flow maps show little change, the resistivity maps show an increase in red areas with aging, confirming that resistivity has increased due to arteriosclerosis.
For detailed calculation methods of BOM, please refer to the paper2 and patent3.
Recent reports
- Ryo Tomita, Takeshi Iwase, Marie Fukami, Kensuke Goto, Eimei Ra and Hiroko Terasaki
Elevated retinal artery vascular resistance determined by novel visualized technique of laser speckle flowgraphy in branch retinal vein occlusion
Scientific Reports, 11(1), 1-11, 10.1038/s41598-021-99572-7, 2021 - Kenji Okamoto, Noriyoshi Takahashi, Tatsuhiko Kobayashi, Tomoaki Shiba, Yuichi Hori and Hitoshi Fujii
Novel superpixel method to visualize fundus blood flow resistivity in healthy adults
Scientific Reports, 13, doi:10.1038/s41598-023-33450-2, 2023. - FUJII, H. et al. Blood Flow Dynamic Imaging Diagnosis Device and Diagnosis Method. https://patentscope2.wipo.int/search/en/detail.jsf?docId=WO2018003139 (2018).
In a word, it represents the ease of blood flow blow-through within one heartbeat. A higher value indicates easier blow-through and lower resistance, while a lower value indicates weaker blow-through and higher resistance.
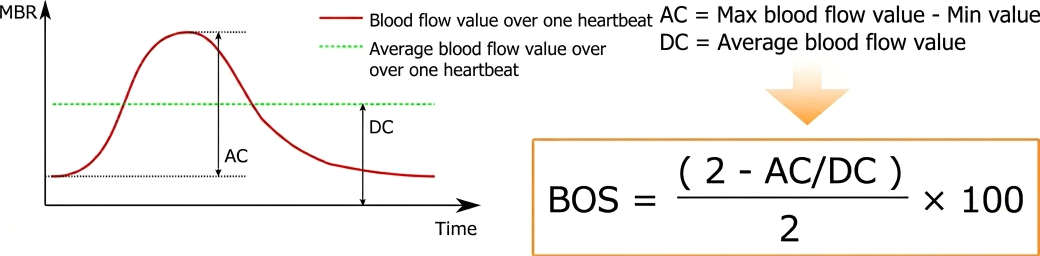
Blood flow fluctuation (= blood flow amplitude) is considered proportional to the power of blood flow caused by the heartbeat, and this power causes maximum dilation of the vessel during systole. This blood flow fluctuation is the difference between the blood flow at maximum expansion (MAX) and the steady-state flow during diastole (MIN). Since this difference is caused by the pressure difference of the heartbeat, the parameter obtained by dividing this heartbeat-induced blood flow fluctuation by the mean blood flow value is considered to represent blood flow resistance (maximum resistance).
Based on this concept, BOS (Blowout Score) was developed as a resistance parameter to evaluate the amount of blood flow that blows through the vessel during one heartbeat*1. If the maximum score of a test is 100 points, BOS is a scale-converted value where approximately 80, which is considered an optimal level, is set as the optimum value.
BOS is considered an index related to vascular resistance, and it is thought to evaluate how well blood flow is maintained during one heartbeat.
The difference from Fluctuation, which also indicates resistance, is that BOS more strongly reflects systolic resistance, whereas Fluctuation represents resistance dominated by the diastolic phase. BOS and similar parameters may be more suitable for discussing the resistance of the heart's pumping mechanism and simple large vessel resistance, while Fluctuation may be more suitable for discussing the resistance of the peripheral vascular bed.
The name BOS was proposed by Toho University Medical Center Sakura Hospital, which has been actively exploring applications in internal medicine and cardiology, to make it clinically intuitive and easy to understand.
The components used to derive BOS are the steady-state component of blood flow (DC: mean blood flow) and the fluctuation component (AC: range of blood flow variation).
When the steady-state component (DC) is high, blood flow is evaluated as being stably maintained, and BOS shows a high value.
When the steady-state component (DC) is low and the fluctuation component (AC) is high, blood flow is evaluated as not being stably maintained, and BOS shows a low value.
Below are choroidal blood flow waveforms from age-grouped samples.
A correlation between BOS and age has been reported*1, and as a trend, BOS decreases with aging.
| 20s | 30s | 60s |
 |
 |
 |
| BOS=86 (AC=4 / DC=15) | BOS=83 (AC=3 / DC=9) | BOS=66 (AC=6 / DC=9) |
| The steady-state component (DC) is high, and BOS shows a high value. | Compared to the 20s, the steady-state component (DC) has decreased, and BOS has declined. | Compared to the 30s, the fluctuation component (AC) has increased, and BOS has declined. |
Additionally, there are reports*1 that BOS reflects arteriosclerosis and large vessel stiffness.
BOS is associated with aging, arteriosclerosis, and large vessel stiffness, and as aging and stiffness progress, BOS decreases.
In other words, it has been reported that blood flow is not maintained in a steady state and fluctuations become larger.
The normal range of BOS is considered to be in the vicinity of 75, but further investigation and verification of the normal range by comparing with healthy subject data is needed.
BOS is positioned as a core pulse‑waveform parameter reflecting blood‑flow stability.
BOS is a primary outcome strongly and independently associated with HbA1c*2.
Key findings:
-
ONH‑BOS: independently associated with age, gender, pulse pressure, heart rate, spherical refraction, and HbA1c.
-
Choroid‑BOS: independently associated with age, height, pulse pressure, heart rate, and HbA1c.
Recent Reports
- Tomoaki Shiba, Mao Takahashi, Tadashi Matsumoto and Yuichi Hori
Pulse Waveform Analysis in Ocular Microcirculation by Laser Speckle Flowgraphy in Patients with Left Ventricular Systolic and Diastolic Dysfunction
Journal of vascular research, 55(6), 329-337, doi:10.1159/000494066, 2018. [Link] - Chieko Shiba, Tomoaki Shiba, Mao Takahashi, Tadashi Matsumoto and Yuichi Hori
Relationship between glycosylated hemoglobin A1c and ocular circulation by laser speckle flowgraphy in patients with/without diabetes mellitus
Graefe's Archive for Clinical and Experimental Ophthalmology, doi: 10.1007/s00417-016-3437-4, 2016. [Link]
[Waveform Patterns and BOS]
When the mean blood flow (DC) within one heartbeat is low, BOS shows a low value.
 |
 |
 |
When the mean blood flow decreases, BOS also decreases. |
| BOS: Hi | BOS: Low |
When the mean blood flow (DC) within one heartbeat is low and the amplitude (AC) is large, BOS shows a low value.
 |
|
 |
When the fluctuation component is large, BOS decreases. |
| BOS: Hi | BOS: Low |
[Supplementary Note]
Before BOS was formulated with its current equation, it was displayed as "AC/DC" in the analysis software. Considering clinical ease of understanding, the name was changed to BOS and the formula was revised to the current one.
[Notes Regarding BOS]
In areas where an opaque, thick membrane (such as the stratum corneum or retinal pigment epithelium) that appears to have low blood flow velocity covers the upper layer, it obscures underlying areas with abundant blood flow. As a result, the response is lower than the actual blood flow fluctuation, and BOS may show a higher value than expected.
In a word, it represents the duration (proportion) of blood flow. Another characteristic is that it indicates the degree of progression of arteriosclerosis.
When a blood vessel dilates, it expands with elastic force. A flexible blood vessel has abundant elasticity and therefore stretches smoothly, contracting gently. → The duration of blood flow is long (BOT is high).
On the other hand, in a blood vessel where arteriosclerosis has progressed, the vessel is stiff, so when blood pressure is applied, the vessel tries to expand rapidly, but because it is stiff, it contracts immediately. → The duration of blood flow is short (BOT is low).
A high BOT suggests elastic blood vessels with slow progression of arteriosclerosis, while a low BOT may indicate that arteriosclerosis has progressed.
BOT indicates the proportion of time within one heartbeat during which the blood vessel is dilated, so it better reflects the state of arteriosclerosis. For this reason, the BOT of the entire optic nerve head shows a negative correlation with age.
[References]
- Tomoaki Shiba, Mao Takahashi, Yuichi Hori and Takatoshi Maeno
Pulse-wave analysis of optic nerve head circulation is significantly correlated with brachial ankle pulse-wave velocity, carotid intima media thickness, and age
Graefe's Archive for Clinical and Experimental Ophthalmology, doi: 10.1007/s00417-012-1952-5, 2012.
On the other hand, healthy individuals who exercise regularly tend to have a lower resting heart rate and better oxygen exchange efficiency.
BOT, which represents the proportion of blood flow duration within one heartbeat, also appears to be relatively lower in those who exercise compared to those who do not. → BOT is low (however, it is not as low as that caused by the progression of arteriosclerosis, so when considering the degree of arteriosclerosis progression, it is necessary to make a comprehensive judgment using both heart rate and BOT.)
BOT (Blow Out Time) is a value that focuses on the half-width of the blood flow waveform and represents the proportion of the half-width within one heartbeat.
The name BOT was proposed by Toho University Medical Center Sakura Hospital, which has been actively investigating applications to internal medicine and cardiovascular research.


In a word, it represents Beat Strength, the intensity of pulsation (beat). A higher BS indicates greater heartbeat intensity.
Additionally, BS is proportional to the amplitude of blood flow. Therefore, BS can be considered equivalent to blood flow amplitude. A larger BS indicates a larger blood flow amplitude.
Here is a brief explanation of what it means when the blood flow amplitude is large.
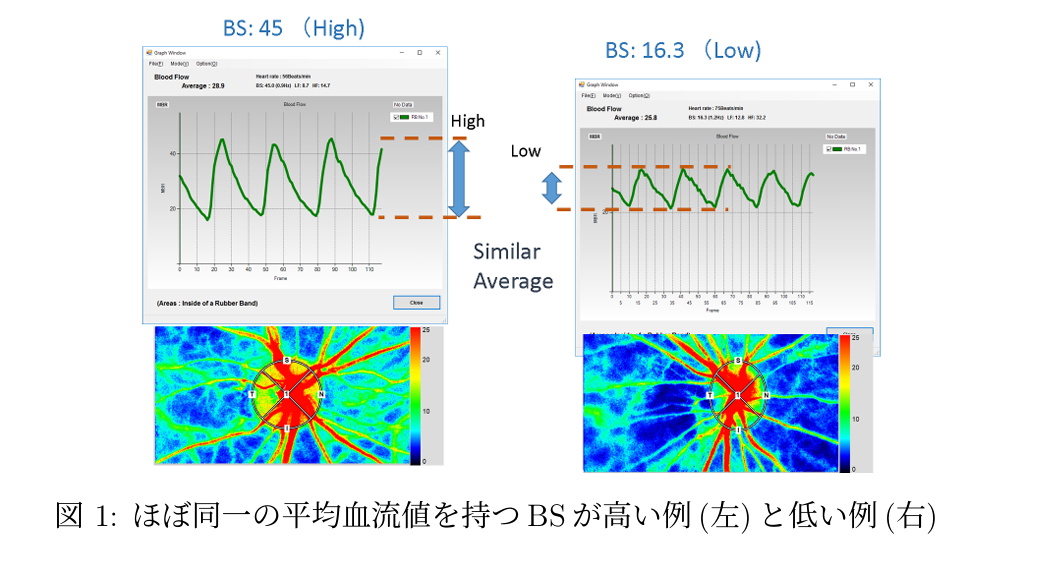
In the following example, BS of the optic nerve head is quantified for blood flow maps with similar mean blood flow values.
While there is no difference in mean blood flow values, the left example has a larger blood flow amplitude compared to the right example. To supply the same mean blood flow, the heart changes the intensity of the heartbeat to deliver blood flow to the peripheral side.
On the left side, it is necessary to increase the heartbeat intensity (BS) and amplify the amplitude, while on the right side, smoother blood flow can be supplied without increasing the load as much. The main difference between these states is the resistance caused by the vascular structure of the flow pathway and the viscosity of the blood itself. Vascular structural changes may largely be due to age-related changes. A high BS (large blood flow amplitude) indicates a state where the heartbeat intensity is increased and the load is elevated.
At sites where inflammation has occurred, it is sometimes observed that blood flow is higher than normal. However, in situations where vessels are compressed, such as with edema, the mean blood flow may not increase as much as expected, and only the blood flow amplitude may become larger. This is a situation where the load is increased in an attempt to deliver blood flow to areas suffering from nutritional insufficiency. By observing BS, the blood flow load status at the observation site can be confirmed (Reference 1). To observe the ease of blood flow, it may be useful to check the resistance. When observing resistance, BOM (= BS/MBR), which divides BS by the mean MBR, is used (Usage example: clinical report observing retinal vascular occlusion status using BOM, Reference 2).
About the Calculation Method of BS
BS does not require heartbeat detection like conventional BOS and other parameters. Instead, it uses a technique that predicts frequency distribution by applying a sparse model to perform time-frequency analysis. Among the obtained frequency distribution, the component with the maximum power is defined as BS and calculated accordingly. For detailed calculation methods, please refer to Reference 3.
Since BS does not require heartbeat detection, it is now possible to obtain BS, an objective numerical index of heartbeat intensity for blood flow dynamics, even from blood flow data where the heartbeat was unstable and waveform analysis was previously impossible. Previously, it was not possible to examine resistance parameters such as BOS in mice and rats with high heart rates, but by applying BS technology, BS and BOM calculations are now possible even in animals with high heart rates, enabling resistance studies. The BS technology can handle frequencies up to approximately 9 Hz, meaning stable BS and BOM values can be obtained for heart rates up to 540 bpm.
References
- Shinsuke Kikuchi, Keisuke Miyake, Yuki Tada, Daiki Uchida, Atsuhiro Koya, Yukihiro Saito, Takehiko Ohura and Nobuyoshi Azuma
Laser speckle flowgraphy can also be used to show dynamic changes in the blood flow of the skin of the foot after surgical revascularization.
Vascular, doi:10.1177/1708538118810664, 2018. - Ryo Tomita, Takeshi Iwase, Marie Fukami, Kensuke Goto, Eimei Ra and Hiroko Terasaki
Elevated retinal artery vascular resistance determined by novel visualized technique of laser speckle flowgraphy in branch retinal vein occlusion
Scientific Reports, 11(1), 1-11, 10.1038/s41598-021-99572-7, 2021 - Kenji Okamoto, Noriyoshi Takahashi, Tatsuhiko Kobayashi, Tomoaki Shiba, Yuichi Hori and Hitoshi Fujii
Novel superpixel method to visualize fundus blood flow resistivity in healthy adults
Scientific Reports, 13, doi:10.1038/s41598-023-33450-2, 2023.