")
")
In a word, it is a numerical value representing the resistance of retinal blood flow within the eye. A higher TCR indicates higher retinal blood flow resistance.
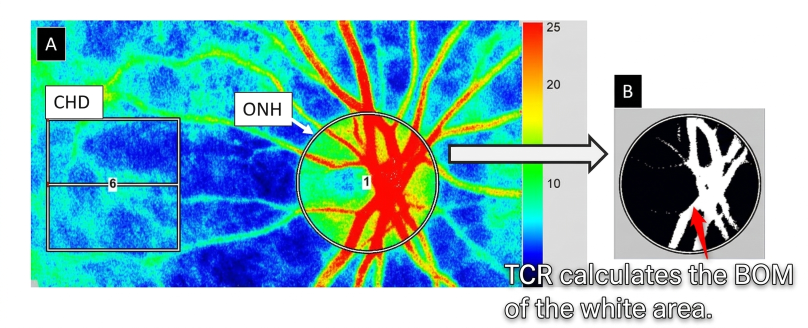
In LSFG, BOM exists as a new resistance index that does not require heartbeat detection. BOM quantifies the resistance of blood flow at any given location, and TCR (Total Capillary Resistance) is the BOM of the large vessel area (including arteries and veins) on the optic nerve head.
In this way, TCR represents the difference in resistance between blood flow measured from the large vessels of the optic nerve head (ONH) and the capillaries, and is a parameter used to estimate retinal vascular resistance.
Clinical applications include CRVO2 and glaucoma3, among others.
- Application in CRVO
The graph below is an excerpt from a published paper2 on CRVO cases. It summarizes the differences in TCR among healthy subjects, the affected eyes of CRVO patients, and the fellow eyes.
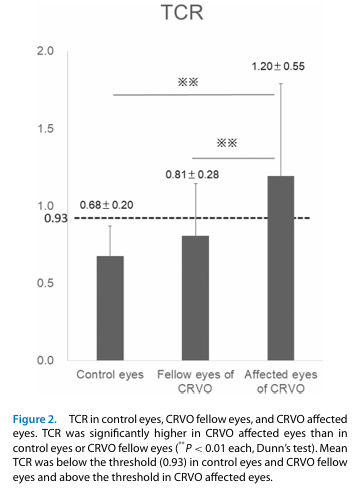
It can be seen that TCR in the affected eyes of CRVO is significantly higher compared to healthy eyes and fellow eyes. Furthermore, a cutoff value for TCR between healthy subjects and CRVO eyes (= 0.93) has been reported, suggesting that TCR can serve as a good indicator for CRVO.
- Application in Glaucoma
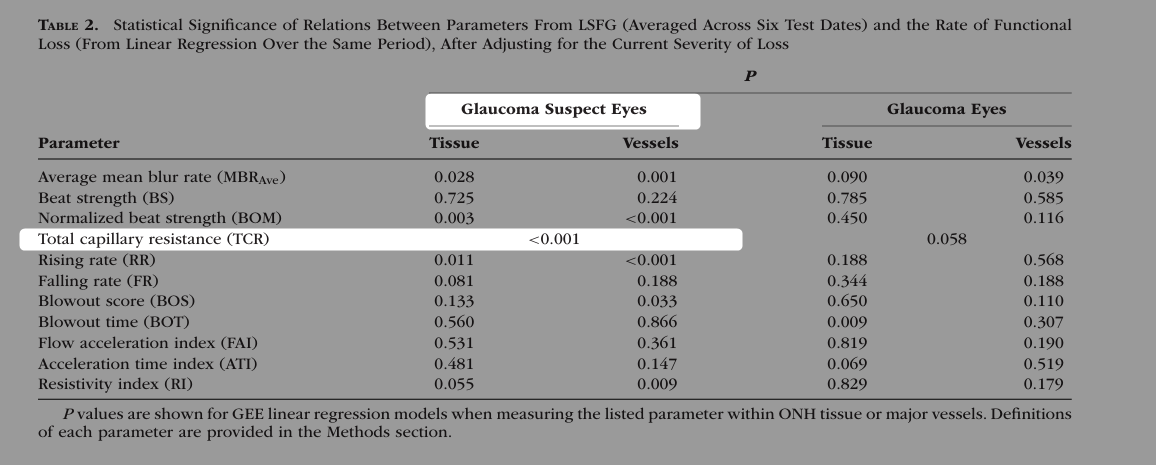
According to the literature3, when TCR is high, retinal vessels tend to be stiffer, and this stiffness has been suggested to be associated with progressive visual function decline. In particular, TCR is considered an important factor indicating the risk of progressive visual function decline. However, high TCR is not always strongly associated with the degree of existing visual function decline, and this is considered useful for risk assessment at an early stage.
Recent Reports
- Kenji Okamoto, Noriyoshi Takahashi, Tatsuhiko Kobayashi, Tomoaki Shiba, Yuichi Hori and Hitoshi Fujii
Novel superpixel method to visualize fundus blood flow resistivity in healthy adults
Scientific Reports, 13, doi:10.1038/s41598-023-33450-2, 2023. - Makiko Matsumoto, Kiyoshi Suzuma, Fumito Akiyama, Kanako Yamada, Shiori Harada, Eiko Tsuiki and Takashi Kitaoka
Retinal Microvascular Resistance Estimated from Waveform Analysis Is Significantly Higher With a Threshold Value in Central Retinal Vein Occlusion
Translational Vision Science and Technology, 9(11), 4, doi:10.1167/tvst.9.11.4, 2020. - Stuart Keith Gardiner, Cindy Albert, Brad Fortune, Steven L Mansberger and Grant Cull
Retinal vessel pulsatile characteristics can predict functional progression in glaucoma suspects
Investigative Ophthalmology and Visual Science, 64(8), 3778, 2023 ARVO Annual Meeting abstract, 2023.
VC is a parameter that quantifies the degree of clarity of blood flow images. A higher value indicates that vascular outlines are more clearly visible1. It quantifies spatial contrast using a proprietary technique.
Clinical applications include CRVO and Pediatric Optic Neuritis2, among others. It can also be used as an index for identifying poor-quality LSFG images1.
- Application in CRVO
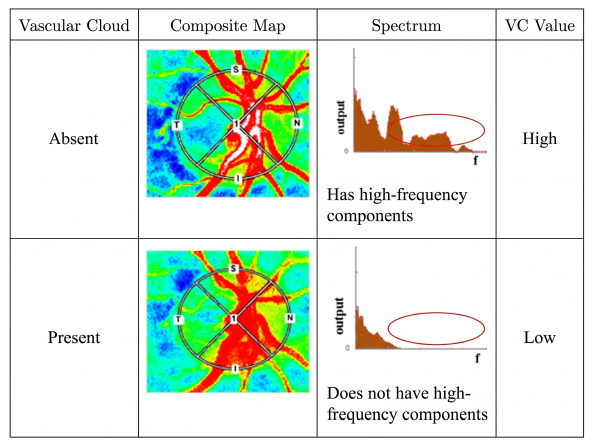
In conditions such as CRVO, collateral circulation pathways may form around the optic disc. In blood flow maps measured by LSFG, this area appears cloud-like, which is why it was named Vascular Cloud (VC).
When Vascular Cloud appears, the overall image becomes flat and featureless as shown below. Compared to cases where vascular tracings are clear, frequency analysis of a Vascular Cloud-affected image reveals that only low-frequency components are detected. By quantifying this frequency distribution, the VC value is calculated, and a higher VC value indicates clearer vasculature.
The cutoff value for VC targeting CRVO is 0.28, and it appears that there is a risk of macular edema (ME) recurrence while the VC value remains below 0.28.
- Application in Identifying Poor-Quality Images1
VC is a useful index for identifying poor-quality LSFG images and is helpful for excluding images with low acquisition quality. A higher VC indicates a clearer image.
- Healthy eyes: Cutoff 0.24 (values below 0.24 may indicate poor image quality)
- Glaucomatous eyes: Cutoff 0.28 (values below 0.28 may indicate poor image quality)
Recent Reports
- Kiyota, N. et al.
Utility of laser speckle flowgraphy-derived vascular cloud for differentiating poor image quality data.
Nippon Ganka Gakkai Zasshi127(5), 549–556 (2023). [Google Scholar] - Ryuya Hashimoto, Mizuho Oyamada and Takatoshi Maeno
Analysis of Optic Nerve Head Circulation Using Laser Speckle Flowgraphy in a Case of Pediatric Optic Neuritis
EC Ophthalmology, 9(8), 572-581, 2018.
The name Vascular Cloud was proposed by the Department of Ophthalmology, Nagasaki University Hospital, which has been actively exploring clinical applications, to make it clinically intuitive and easy to understand.
Revision: 20260310
In healthy subjects, optic disc tissue blood flow tends to show relatively stable values.
The choroid and retinal vessels give the impression of greater variation, being somewhat affected by diurnal fluctuations and heart rate/blood pressure.
Living tissue can be regarded as a collection of numerous scattering particles. As shown in the figure below, consider a model in which laser light is scattered by particles randomly distributed in space, and we will explain why speckle patterns occur in this process.

If the numerous scattered wavefronts arriving at a certain point P on the observation plane from these particles happen to interfere in phase, they reinforce each other and that point becomes bright.
However, at another point Q, the optical paths of the scattered wavefronts arriving from each particle form a different combination, so they may become out of phase and cancel each other out, making that point dark.
Recall how two wavefronts interfered in Young's interference experiment. Now extend this and imagine what happens when a very large number of wavefronts interfere randomly.
Since the positions of the scattering particles have no regularity whatsoever, whether a given point becomes bright or dark cannot be known until the interference actually occurs—and the same is true for neighboring points. In other words, whether a point becomes bright or dark follows a stochastic process.
The interference pattern formed in this way does not become a regular fringe pattern but rather a random speckle pattern. If all scattering particles are stationary, this pattern also remains stationary.