")
")
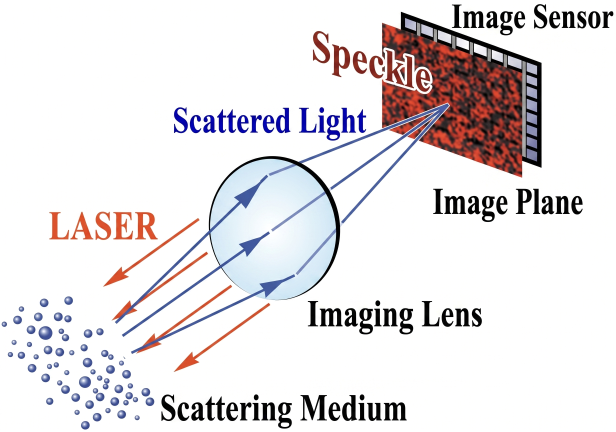
As shown in the figure, when living tissue is illuminated with a laser, scattered light randomly interferes with each other, generating speckles throughout the area. As shown in the figure, when the living tissue is imaged onto a screen through a lens, fine speckles also appear within this image. The speckle pattern at each point on this image plane changes moment by moment in accordance with the movement of blood cells near the corresponding point on the object plane—that is, the living tissue. By placing an image sensor on this image plane and calculating the rate of temporal change of the speckle pattern for each point, and displaying this as a map, it becomes possible to visualize blood flow in living tissue.
MBR values do fluctuate due to blood pressure and pulse rate. When measuring blood flow at rest and after exercise (going up and down stairs) in the same subject, the values do indeed increase.
However, since we have not conducted a quantitative study with a large sample size (N) on the relationship between the increase in pulse rate and blood pressure and MBR values, we are unable to provide specific amounts of change.
We have investigated diurnal variation here, and although the sample was limited, we performed blood flow measurements throughout the day while simultaneously measuring blood pressure with a sphygmomanometer and pulse rate with a pulse meter.
The results showed that blood flow variation patterns differed among individuals, and there was variability in the blood pressure monitor output, so no apparent correlation with blood flow values was observed.
As for diurnal variation, blood flow values (MBR) showed fluctuations of approximately ±10% at the most variable sites and approximately ±7% at the least variable sites throughout the day.
This question often arises when obtaining measurements with variable output values. First, regarding pupil diameter: the pupil naturally dilates in a dark room, but there is considerable individual variation in pupil diameter, and sometimes the laser beams may not pass through both paths. The latest NAVI model has been adjusted to enable measurement with a pupil diameter of 5 mm or larger.
When blood flow values tend to vary, even when attempting to establish a control by taking initial measurements without any intervention, patients may initially show lower blood flow readings due to nervousness (stress?).
For example, if values seem to vary after three consecutive measurements because the pupil diameter was borderline, using a mydriatic agent may reduce alignment errors and stabilize the values.
In LSFG, blood flow values are quantified as "MBR," and these values are represented in pseudo-color (*) to create blood flow maps.
When shipping LSFG-NAVI units, we perform characteristic evaluation using our in-house calibration equipment and characteristic evaluation by actually measuring human eyes, adjusting the characteristics to meet the following standards:
- Black when scattering particles on the observation surface are stationary
- Red on the central retinal artery and vein of the fundus
- Varies linearly with the movement speed of scattering particles between these two extremes
*Definition of pseudo-color
The LSFG blood flow map displays pseudo-colors in the following order from highest to lowest blood flow value: "Red → Yellow → Yellow-green → Cyan → Blue → Black."

Fundus blood flow map sample (the color bar displayed on the right edge defines the pseudo-colors)
Scattering particles inside a living body, typically represented by blood cells, are almost always in motion, so the interference conditions at every point on the observation plane change from moment to moment. In fact, speckles generated from living tissue change their pattern at an extremely rapid rate. As shown in the figure below, when the observation plane is at the image plane of the living body surface, a point on the living body and its corresponding image point are linked in a one-to-one relationship. That is, the rate of change of speckle at a given image point is determined by the migration speed of scattering particles (in this case, blood cells) in the vicinity of the corresponding point on the object, and the former is approximately linearly proportional to the latter. If the blood flow velocity at a given point on the living body surface decreases, the speckle fluctuation at the corresponding point on the image plane becomes slower. Therefore, if we calculate the temporal rate of change of the speckle at each point on the image plane and display it as a map, that directly represents a map of blood flow velocity.
The question of what range of scattering particle movement contributes to the light intensity fluctuation at a given point on the image plane is extremely complex. Organizing what has been understood so far, the following two factors need to be considered.
1 No matter how sharp an imaging system is, it cannot form a perfect point image of a point object due to aberrations and diffraction effects. Conversely, this means that wavefronts scattered from a small area on the object surface overlap at a point on the image plane. This is related to the question of how thin a blood vessel's blood flow the LSFG system can measure.
2 As the laser penetrates deeper into the living body, it diffuses and is absorbed, but the scattered wavefront emerging from a point on the living body surface toward the imaging system has traveled various paths within the body. Some exit from a very shallow layer near the surface without much scattering, while other wavefronts exit after penetrating quite deep. The latter, having wandered around extensively, become considerably weakened, resulting in only faint light. If we could eliminate the strong scattered light coming from the surface and capture only the weak scattered light coming from deep within, it seems we could observe deep-layer blood flow maps. However, this is quite difficult and remains one of our important research themes.