")
")
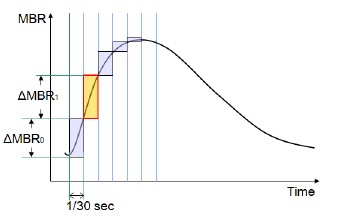
In a word, it is the acceleration of blood flow. It quantifies the degree of the momentum of blood flow. A higher FAI indicates stronger momentum.
FAI (Flow Acceleration Index) calculates the maximum change in increasing MBR and indexes the instantaneous force that increases blood flow in a short period. Since it represents the maximum change during the relatively rapid expansion of blood vessels reaching the peak due to arterial pulsation, it is also a parameter that reflects the strength of blood flow ejected from the heart, which is the supply source.
It represents the maximum value of the change per frame (1/30 sec).
Recent reports
- Chie Iwase, Takeshi Iwase, Ryo Tomita, Tomohiko Akahori, Eimei Ra, Kentaro Yamamoto and Hiroko Terasaki
Changes in pulse waveforms in response to intraocular pressure elevation determined by laser speckle flowgraphy in healthy subjects
BMC Ophthalmology, 21(1), 1-13, doi:10.1186/s12886-021-02070-7, 2021. - Yamamoto Nobuhiko, Nakano Makoto, Nochioka Kotaro, Yasuda Masayuki, Kunikata Hiroshi, Nakazawa Toru, Yasuda Satoshi
Ocular blood flow dynamics following sinus rhythm restoration through catheter ablation: laser speckle flowgraphy in patients with persistent atrial fibrillation
European Heart Journal - Imaging Methods and Practice, 2(3), Jul 2024. doi:10.1093/ehjimp/qyae071 [Link]
In a word, please consider it as mean resistance. Blood vessels undergo contraction and dilation with each heartbeat to deliver blood flow to the periphery, and resistance changes from the systolic to the diastolic phase. The effective blood flow that carries nutrients increases or decreases depending on the mean resistance, so it is suitable for observing permanent resistance values.
A higher value indicates higher resistivity, and a lower value indicates lower resistivity.
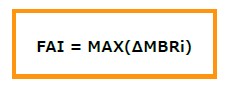
Please refer to the diagram on the right for an explanation of fluctuation.
It is a metric that displays high values for items with large fluctuations and low values for items with small fluctuations, representing a fluctuation rate similar to AC/DC.
The formula involves accumulating the differences between each sample value and the mean, taking the average, multiplying by a coefficient for readability, and dividing by the mean.
The difference from resistivity values of BOS and BOM is that fluctuation is calculated for each point of the temporal change in blood flow within one heartbeat, so it reflects not only the resistance during the systolic phase but also the resistance through the diastolic phase. For this reason, we consider it as mean resistance.
Since the amount of variation from the mean is accumulated and divided by the mean, you may understand it as something close to variance in statistical terms.
When considering the fluctuation rate map for fundus blood vessels, arteries tend to show higher fluctuation rate values compared to veins because their fluctuation is greater. However, it does not seem to separate arteries and veins as clearly as Skew.
 LSFG stands for Laser Speckle Flowgraphy, which is the name of a blood flow imaging device that utilizes laser scattering.
When a biological surface is illuminated with a laser, the scattered light interferes with each other to create a random speckle pattern as shown in the figure.
This pattern is generally called Laser Speckle, and because it is used to obtain blood flow maps, the device was named LSFG.
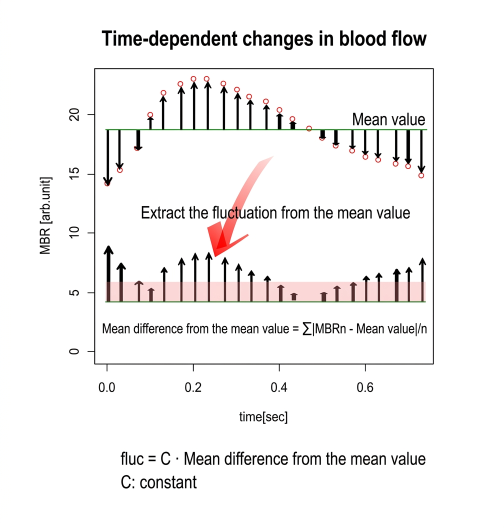
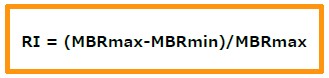
In short, RI represents resistance based on blood flow. A higher RI indicates higher resistance.
Generally, when expressing resistance, the range of change (maximum minus minimum) is divided by the mean value. However, this RI divides by the maximum value. This follows the RI that was theoretically established with Doppler flowmetry, and was implemented as a parameter in LSFG for comparison purposes. Since it divides by the maximum value, changes in resistance are larger compared to dividing by the mean value.
RI (Resistivity Index) is the value obtained by dividing the difference between the maximum and minimum MBR values by the maximum MBR value.
In a word, it is an index representing the strength of the momentum of blood flow waves.
In arteries, the blood flow momentum pumped from the heart is strong, causing the waveform to be left-skewed. On the other hand, as the momentum weakens, the waveform peak gradually recedes. The waveform that has passed through the peripheral vascular bed and returned to the veins has diminished momentum, and Skew becomes lower. The parameter that quantifies this momentum by focusing on the shape of the waveform is Skew. A higher Skew value indicates stronger momentum, while a lower value indicates a state where momentum has been lost.
For example, if blood flow is supplied to an observation point through multiple pathways, and those pathways are short, the blood flow momentum is maintained and arrives at the observation point with a high Skew. On the other hand, blood flow that has traveled a long distance through detour pathways loses its momentum and arrives with a lower Skew. Since the blood flow momentum at the observation point is quantified, it is possible to determine whether the blood flow pushed out by the heartbeat reaches the observation point with sufficient momentum.
Additionally, blood flow through collateral circulation pathways may show a high Skew even in veins, because the path length is shorter than usual.
To provide a brief technical explanation, Skew was developed as an index representing the state of systemic circulation momentum. It is a quantification of the shape of the blood flow waveform.
Skew is derived from skewness in statistics, which indicates the asymmetry of a distribution,
and its value primarily changes depending on the bias (overall shape) of the blood flow waveform.
 |
 |
 |
| Skew>0 | Skew=0 | Skew<0 |
When the waveform shape is symmetrical, Skew equals 0. Based on this reference, if the waveform is biased to the left, Skew takes a positive value.
Conversely, if biased to the right, Skew takes a negative value. Additionally, the greater the bias, the larger the absolute value of Skew becomes.
In arterial vessels, because blood flow rises rapidly, Skew > 0.
In venous vessels, because blood flow rises more gradually compared to arterial vessels, arterial Skew > venous Skew.
Skew also changes depending on how the waveform descends from the peak.
Even when the peak position is the same, the faster the decline from the peak, the larger the Skew becomes.
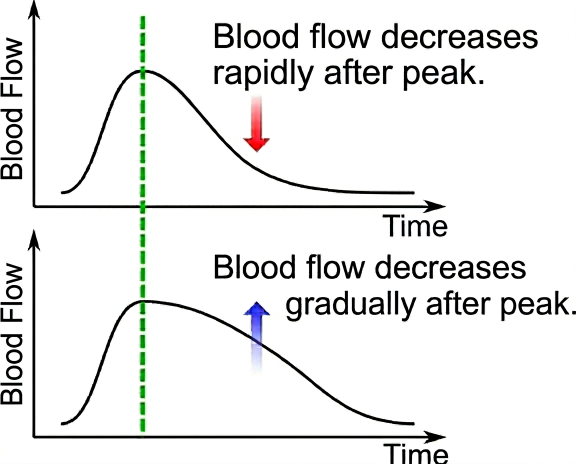 |
Skew becomes larger
|
| Skew becomes smaller |
Skew has been reported to correlate with age, with Skew increasing with advancing age.
It is considered to have potential as an index of arteriosclerosis.
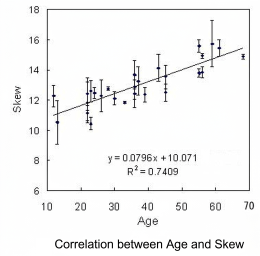
Details on the calculation method of Skew and its correlation with age are presented in the following paper.
Please refer to it.